 The Right Stock At The Right Time®
| The Right Stock At The Right Time® |
|
||
|
Using Cyclical Analysis to Determine Intermediate Term
Targets
There are three circumstances that cause traders to close a position. A stock violates a stop loss level, trades through a predetermined target or the trader's stomach can't take it anymore. Using stops to close a position has its advantages. In the event you find yourself on the right side of a run away train, you will realize most of the move. The problem is that most stocks typically trade in a 10% to 30% range and using stops result in small average gains. Better results can be achieved by determining targets and exiting when they are achieved.
There are several ways to determine realistic targets with the most reliable method being a form of a cyclical analysis. When using cyclical analysis to determine intermediate term price projections, focus on Cycle B which has an average time duration of 20 weeks. In theory, a stock's price would go up for 10 weeks and then decline for 10 weeks completing the 20-week cycle. Construct a half cycle which is simply a 10-week simple moving average. When the moving average turns up, note the closing price for the stock. Now count back 5 weeks and note the stock's closing price. Take the difference between the two closes and add it to the most recent close. That is the preliminary target that should be achieved over the next 5 weeks. Conversely, when the 10-week moving average turns down, note the closing price for the stock. Count back 5 weeks and note the closing price. Take the difference between the two closes and subtract it from the most recent close. That is the preliminary target that should be achieved.
The following weekly charts for WMT, KLAC and KNT will demonstrate how this technique
works when determining preliminary targets.
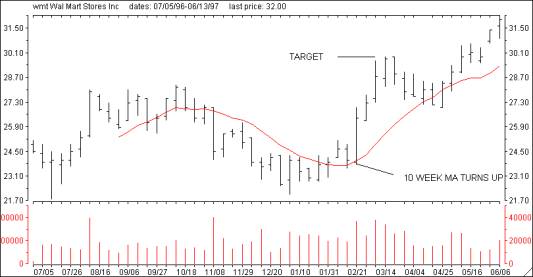 WMT'S 10 week moving average turned up on 2/28/97 when the stock closed at 26.38. Counting back 5 weeks to 1/24/97 we note the closing price of the stock, 23.00. The 3.38 point difference is added to 26.38 suggesting a target of 29.75, a 13% move. WMT traded through 29.75 the week ending 3/27/97. 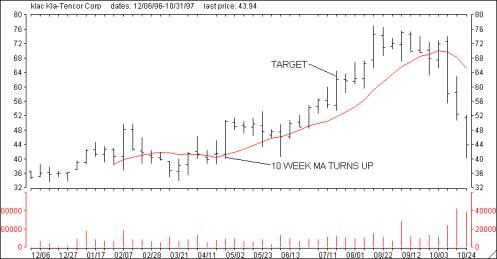 KLAC's 10 week moving average turned up on 5/2/97 when the stock closed at 50.00. Counting back 5 weeks to 3/27/97 we note the closing price of the stock, 38 1/4. The 11 3/4 point difference is added to 50.00 suggesting a target of 61 3/4, a 23% move. KLAC traded through 61 during the week ending 7/25/97. 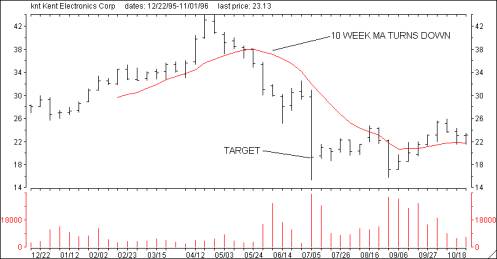 KNT's 50 day moving average turned down on 6/7/96 when the stock closed at 31.00. Counting back 5 weeks to 5/3/96 we note the closing price of the stock, 41.00. The 10 point difference is subtracted from 31.00 suggesting a downside target of 21.00, a 33% move. KNT traded through 21.00 during the week ending 7/12/96 on its way to the mid teens. Computing targets in this manner gives you another tool when narrowing your stock selections. Using a 10-week moving average in this manner is actually measuring the stocks short-term momentum. A large projected gain simply means that the stock has been experiencing a powerful move over the past 5 weeks, a move that is likely to continue. When selecting stocks, you obviously would rather buy one that has a 25% upside potential versus one with only a 5% projection. In the above analysis, KLAC was obviously a better prospect than WMT. The Second Opinion Confidence Rating (C-Rate), located in the Opinion box, is the percentage gain that can be expected for the stock based on this method of calculating targets. The C-rate is calculated by combining the projected percentage move and the Power Rating with the result being a value that can range from -30 to +30. By multiplying the C-Rate by 3, you can estimate the projected percentage move remaining in the stock. A stock that closes at 20 with a C-Rate of 4.5 would have a target of 22.70 (13.5%). As the stock approaches 22.70, the C-Rate will decline until it reaches 0. The most reliable C-Ratings range between +5 to +10 on the bullish side and -5 to -10 for short sale candidates. High C-Rates typically indicate some form of unusual prior trading activity caused by take over rumors or negative earning surprises and are therefore suspect.
|