The Right Stock At The Right Time®
| The Right Stock At The Right Time® |
|
||
|
Up/Down Volume Ratio & Slope
The following is an example of how this indicator is calculated. Assume that stock XYZ trades 100,000 shares on Day #1 and closes up 1/2 point. On Day #2, XYZ trades 200,000 shares and closes down 1 point. The U/D Volume Ratio for XYZ over this period would be 0.5 (100,000/200,000). A 0.5 ratio indicates that over the two day period, twice as much volume was attributed to selling as to buying, a negative for XYZ. Market Edge calculates Up/Down Volume Ratios over 50-day time periods and reports the value on the Second Opinion screen (U/D Ratio) in the volume analysis section.
Although the U/D Ratio is a powerful indicator, testing has concluded that it is the trend or slope of this ratio that signals a change in the trend of a stock's price not the raw value. The reason is simple. A ratio that is increasing from 1.2 to 2.5 indicates that there is a growing amount of buying induced volume, a bullish condition. However, if the ratio is declining from 2.5 to 1.2 there is an increase in selling induced volume, which is a bearish situation. In either case the U/D ratio is regarded as bullish since it is above 1.0.
In order to determine the slope or direction of the U/D Ratio, Computrade Systems Inc. has developed a proprietary indicator called the Up/Down Volume Ratio Slope (U/D Slope). U/D Slope is the linear regression line of the U/D Ratio. The indicator is bullish when the angle of the regression line is rising. Conversely, when the line is pointed down, the indicator is bearish.
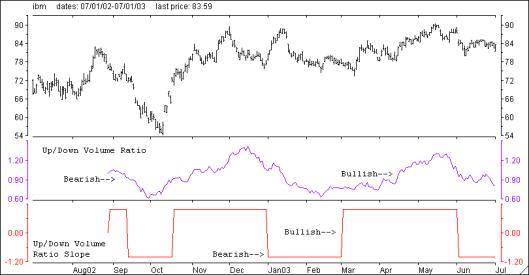
To illustrate the predictive power of these indicators, refer to the chart of IBM located below. The first graph positioned under the price chart is the U/D Ratio. This indicator is regarded as bullish when its value is above 1 and bearish when less than 1. The graph under the U/D Ratio is the U/D Slope. This indictor is bullish when the value is +1 indicating a positive slope of the U/D ratio. Conversely, when the slope is negative, the indicator will be a bearish -1.
U/D Slope is one of the five components used in generating the Market Edge 'Power Ratings', which are used in formulating the 'Opinion' (Long, Neutral & Avoid) for each stock in the Market Edge universe. It is also used in calculating the Strength Indexes for DIA, QQQQ & OEX. Typically, when a stock's technical condition is beginning to change, the U/D Slope will be the first indicator to reverse. Therefore, this indicator should be monitored on a regular basis since it provides early warnings of a potential change in the trend of a stock's price.
|
 The Up/Down Volume Ratio is a powerful technical tool that identifies stocks that have a high probability of experiencing either a prolonged up or down move. This indicator identifies stocks that are either under accumulation (Bullish) or experiencing distribution (Bearish). The Up/Down Volume Ratio is computed by totaling the stock's volume on days when it closes up and divide that total by the volume traded on days when the stock closed down. The assumption is that if a stock closes up for the day, the volume was buying induced and thus the stock is under accumulation. Conversely, if a stock closes down for the day, the trading activity is deemed to be selling induced, a sign of distribution. Up/Down Volume Ratios greater than 1.0 are considered to be Bullish while ratios less than 1.0 are regarded as Bearish.