 The Right Stock At The Right Time®
| The Right Stock At The Right Time® |
|
||
|
Support And Resistance
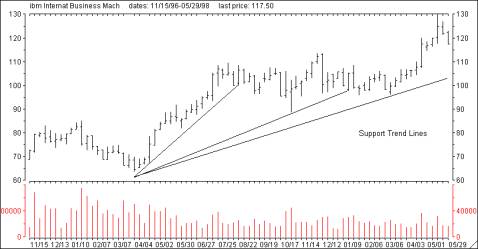
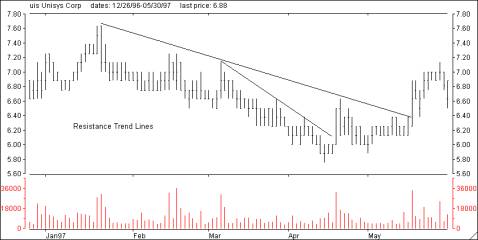
Support and resistance trend lines are constructed by connecting either the most recent, significant low points (support) or high points (resistance) on a stock's chart. To have a valid support trend line, the slope of the line must be pointed up. Conversely, the slope of a valid resistance trend line must be pointed down.
Market Edge constructs three support and resistance trend lines for each stock in its database. The reported values represent the value of the trend line that is farthest away from the closing price of the stock provided that the close is less than 20% from the trend line. If the stock's close is more than 20% away from either the support or resistance trend line, the value of the next closest trend line is reported and so on. In situations where the trend lines are not pointed in the proper direction, a NA will be reported instead of a value.
Penetration of these trend lines is a warning that the prevailing trend is waning and a reversal
is highly probable. In addition, support and resistance areas are typically good entry or
exit points. If you are long a stock that penetrates its support line, defensive action is
warranted. Conversely, a good entry point occurs when a stock retreats to support and fails
to penetrate the trend line. The following charts show the proper construction of support
and resistance trend lines for IBM and UIS.
The second most reliable method of determining support and resistance areas is known as range analysis. These areas typically form as a stock makes a significant move either up or down. Since a stock's price doesn't move in a straight line, an extended move usually looks like a set of stairs. As price moves upward, there are corrective periods creating a step or congestion area followed by a continuation of the upward move. By connecting the bottoms formed during the correction phase, a support area is defined. Any pullbacks to this area should be met by additional buying pressure or support. The opposite is true for a stock that is in a downtrend. Again, the step formation is formed as areas of resistance develop on recovery rallies. Any rally back to a resistance area should be met by additional selling pressure. Support and resistance ranges are also reported on the Market Edge Second Opinion report. The following charts show support and resistance areas for NI and HOT. 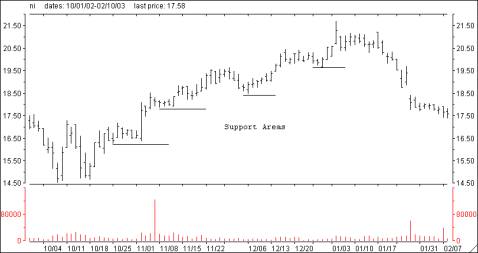 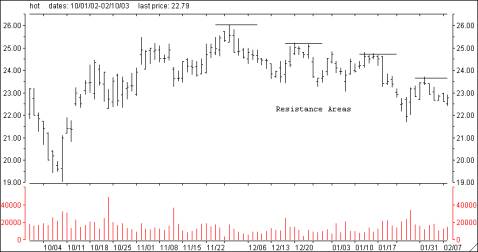
|
 Support and resistance areas are important for two reasons. First, penetration of either support or resistance typically forewarns of a trend reversal. Secondly, as a stock approaches these areas but fails to penetrate, it can prove to be a good entry or exit point. The two traditional methods of determining support and resistance areas are trend line and range analysis.