 The Right Stock At The Right Time®
| The Right Stock At The Right Time® |
|
||
|
Placing Protective Stop-Loss Orders
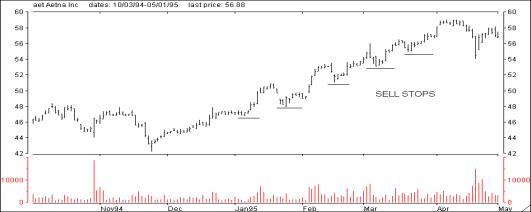
Stops should remain unchanged if the price of the stock moves lowers. However, as the price of the stock moves higher, the stop should be adjusted upward. The following chart shows the proper placement of sell-stop orders as AET moved up in price over the January-April time frame.
 Locating the most recent, previous cyclical high from the time a position was originated and adding 1/2 of a point produces the buy-stop for a short sale position. The chart below shows the initial buy-stop at 53 for a short-position in General Motors (GM) opened in mid-September @ 50. As GM sank, the buy-stop orders would have been adjusted down to 41 as the stock traded down to the high 30's. 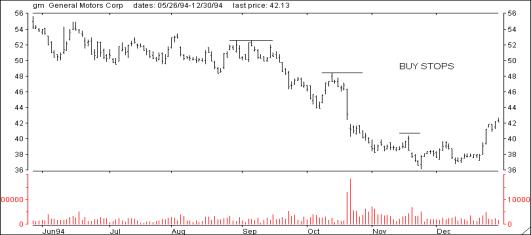 This technique of determing protective stocks is far surperior than the random percentage method. Cyclical analysis takes into effect the volatility of the stock as well as pinpointing significant areas of support or resistance that if violated typically point to a trend reversal. Neither of these factors are considered when simply using a 10% stop. Market Edge computes buy and sell stops based on this technique and includes them on the stock's Second Opinion report.
|
 The best method to determine the location of a protective stop-loss order is derived from cyclical analysis. Long positions are protected with sell-stop orders (GTC) based on the previous cyclical low while short sale positions have buy-stop orders (GTC) based on the stock's previous cyclical high. Locating the most recent previous cyclical low from the time a position was originated and deducting 1/2 of a point produces the sell-stop. In the example below, the initial sell-stop for a long position initiated for Aetna (AET) in mid-January would have been 46.50.