The Right Stock At The Right Time®
| The Right Stock At The Right Time® |
|
||
|
Market Timing – Cyclical Trend Index The Market Edge ‘Market Letter’ combines three proprietary market-timing indexes into a computer model which attempts to forecast the intermediate term
direction of the market as measured by the Dow Jones Industrial Average (DJIA). These indexes are the Cyclical Trend Index (CTI), the Sentiment Index and the
Momentum Index.
The primary component of the Market Posture is the Cyclical Trend Index (CTI).
The underlying premise of the CTI is that the market, as measured by the Dow Jones Industrial Average (DJIA), tends to move in cycles that often resemble sine waves, a basic cycle which determines much of the motion in the universe. The utilization of sine waves in market forecasting is based on studies that demonstrate that stocks, and in particular the DJIA, tend to experience price reversals at anticipated time intervals. These intervals, referred to as cycles, consist of the price movement of the DJIA from a significant low to an identifiable high, followed by a retreat to a recognizable low over a predetermined time frame. There are five identifiable cycles, each with different time durations at work in the market at all times. Cyclical analysis systematically determines the beginning and ending points of these various cycles enabling the analyst to accurately time purchases and sales for maximum profit.
To picture how these cycles influence price direction, visualize the stock market as a piece of elastic that is constantly subjected to positive or negative forces exerting pressure in either the same or opposite direction. These forces are the five cycles that are incorporated in the CTI. The cycles vary in duration with the shortest being only 6 weeks and the longest lasting 4 to 4 ½ years which coincides with a typical business cycle. The following table categorizes each cycle by the average time duration that it experiences from a significant low to either a higher low or new lower low.
Theoretically, each of the above cycles exerts upward pressure at the beginning of its time frame and continues to do so until it is one-half completed. At this point, the process is reversed resulting in negative pressures being applied to the DJIA. Life would be simple if only one of these cycles were factored into the equation. However, when dealing with five cycles, the picture can become confusing. For example, two of the cycles may be pointing up while one is flat and the remaining two are pointing down suggesting a market in flux. Maybe yes – maybe no! In order to get a complete picture of the cyclical status of the market, the positive and negative forces need to be combined into a single indicator that has predictive value. To accomplish this goal, each of the cycles is assigned a numerical value based on the amount of time that has lapsed since its previous cyclical low. Values are positive in the early stages of the designated time frame, and begin to decline as time goes on becoming negative toward the end of the period. The shorter cycles receive higher values since they are more dominant. The total of these values is called the CTI and it is a very powerful tool in forecasting the intermediate term direction of the DJIA. CTI readings of +1 and higher indicate a bullish trend in the market, whereas a 0 to -15 value signals a downward, bearish scenario. The chart below shows the DJIA from 2/7/03 to 02/06/04. Four of the cycles (B, C, D & E) are plotted on the chart. Cycle A is not included because of its short length (6 +or- 1 week). As can be seen from the graph, all of the cycles bottomed the week ending 3/14/03 signaling the end of the 2000 – 2003 bear market. Cycle B (18 +or- 2 weeks) bottomed on 08/15/04 and again on 11/28/04. Cycle C (36 +or- 4 weeks) bottomed in harmony with Cycle B on 11/28/04. Neither Cycle D (72 +or- 7 weeks) nor Cycle E (216 +or- 20 weeks) posted a new bottom over this period. 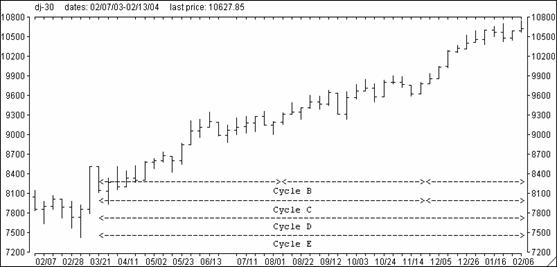 There is one problem that crops up when determining the starting point for each of the cycles. The rule is that when the count for a cycle nears the end of its pre-determined time period, the DJIA must post a higher intra-week low when compared to the previous week’s low. This will cause a reset of that particular cycle’s count to week #1. The problem arises when during the week following a reset a lower intra-week low occurs which would abort the reset and can have a negative effect on the CTI. Compounding the problem is the fact that the cycles are harmonic meaning that they exist within each other. For example, within Cycle E (216 weeks) there are three Cycle D’s (72 weeks), six Cycle C’s (36 weeks), twelve Cycle B’s (18 weeks) and thirty-six Cycle A’s (6 weeks). Cycle D encompasses two Cycle C’s, four Cycle B’s and so on. Since the CTI is the total of the various cycles’s values, an aborted reset can change the CTI. Fortunately, this only occurs once a year when Cycle A, B and C are simultaneously reset, once every 1 ½ years when Cycle A, B, C & D are reset and once every 4 to 4 /12 years when all of the cycles are reset. The CTI is a unique market timing tool in that it is a trend forecaster, not a trend following indicator such as moving average crosses or MACD. Assuming that the projected starting points for the various counts are correct, an extended forecast can be made with a high degree of certainty. Such a forecast is made every month and is presented in ‘On The Edge’ which is located on the Markets page. The forecast projects periods of strength and weakness for the DJIA based on the projected CTI readings.
|