 The Right Stock At The Right Time®
| The Right Stock At The Right Time® |
|
||
|
Technical Indicators For Either A Trading Or Trending Market
When the market is in a trading range, oscillators and short term moving average crosses will produce the best results. If the market is trending, indicators such as Up/Down Volume Ratios, MACD-LT (Long Term) and intermediate term moving average crosses will provide the strongest signals.
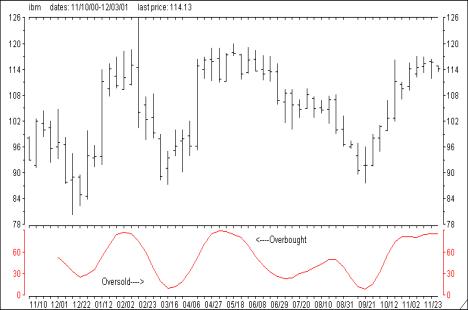
Of the numerous oscillators available to the trader, I feel that the stochastic oscillator (Slow %K) produces the best results in identifying overbought (bearish) and oversold (bullish) conditions during a trading market environment. The stochastic oscillator compares where a stock's price closed relative to its trading range over x-time periods. Values range from 0 to 100. Readings over 80 signal overbought (bearish) conditions, while readings below 20 are regarded as an oversold (bullish) situation.
The first graph located below is a chart of IBM with the Slow %K stochastic oscillator plotted at the bottom. Both overbought (over 80) and oversold (under 20) areas are labeled. Note that on the week ending 3/16/00, Slow %K dipped below 20 as IBM closed at 95. This represented a very oversold situation and an excellent time to purchase IBM shares. IBM proceeded to rally over the next six weeks, topping out at 118 as Slow %K soared to over 80, an overbought condition.
 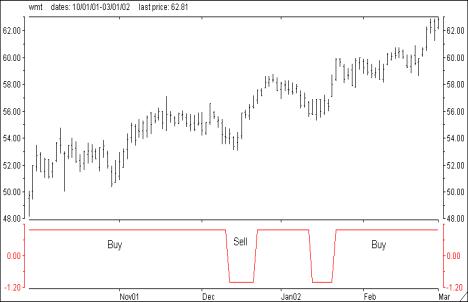
The second chart is Wal-Mart (WMT) from 10/01/01 through 03/01/02 with the MACD-LT indicator plotted below. During this period the market was in a strong trend coming off the September lows. MACD-LT stands for moving average convergence-divergence-long term. MACD, developed by Gerald Appel, consists of three exponential moving averages of a stock's closing price. Exponential moving averages assign greater weight to the most recent price data and therefore is more sensitive than simple moving averages. The MACD indictor has a Differential Line and a Signal Line. The Differential Line is constructed by measuring the difference between two exponential moving averages, a 12 and 26-day time period. The Signal Line is a 9-day exponential moving average of the Differential Line. Buy signals occur when the Differential line crosses the Signal line from below while the reverse generates a sell signal. MACD-LT is a proprietary variation of the standard MACD configuration and is designed to identify longer-term buy/sell signals. As can be seen from the chart, MACD-LT was a very accurate indicator during the run that WMT experienced from 48 - 62 over a five-month period. Both the Slow %K stochastic oscillator and the MACD-LT indicator are located on all of the Market Edge "Second Opinion" reports. In addition, Market Edge (www.marketedge.com) has several screening capabilities which let you search for stocks that are either overbought or oversold based on the status of the stochastic indicator or have experienced either a bullish or bearish MACD-LT cross.
|
 Over a one year period, the market as measured by the Dow Jones Industrial Averages (DJIA), typically spends approximately 70% of the time in a trading range. The remaining 30% of the time the DJIA is usually in either an up or down trend. It is important for the stock trader to recognize which phase the market is in and utilize those technical indicators that perform the best in that environment to time entry and exit points.