 The Right Stock At The Right Time®
| The Right Stock At The Right Time® |
|
||
|
Breadth Indicators That Forecast Major Trend Reversals
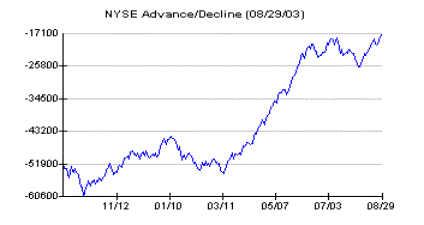
The NYSE Advance/Decline (A/D) Line is a daily running total of the number of NYSE stocks that advances minus those that decline. It is a good measurement of the markets breadth or strength and is an invaluable indicator when attempting to forecast the markets direction. Often, as the end of a bull phase nears, the A/D Line begins to roll over while the DJIA continues to make new highs. Conversely, at major bottoms, the A/D Line will bottom and begin to move up several months before the DJIA puts in its final bottom. Market technicians refer to this phenomenon as bearish divergence at market tops and bullish divergence at bottoms.
The daily and weekly number of new 52-week highs and lows is also a good indication of the markets strength. It isn't necessarily the number that is important, but whether the numbers are expanding or contracting. When the market is in a long-term down trend, the number of new highs will be diminishing while the new lows will expand. As the market tries to find a bottom, a shift will begin to occur as the number of new lows begins to contract. Conversely, at significant tops the number of new highs will begin to contract. If the DJIA makes a new high or new low and the move is not confirmed by an expansion of the number of highs at market tops or lows at a bottom, a trend reversal is usually at hand. 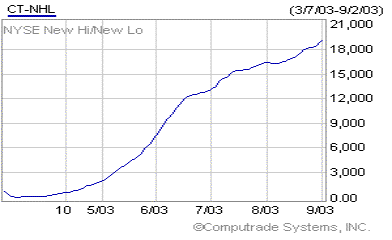
Both of these breadth indicators are included in the Market Edge market timing models. They can be found in the "Market Letter", located on the 'Markets' page. The graphs can also be found in the Market-At-A-Glance area on the 'Home' page under Market Recap.
|
 Breadth is a market technician's term used to describe the markets strength or weakness. Breadth can be measured several ways with the NYSE Advance/Decline line and the number of new 52-week highs and lows being the most popular indicators.