New QuickChart
[et_pb_section bb_built=”1″ admin_label=”section”][et_pb_row admin_label=”row” background_position=”top_left” background_repeat=”repeat” background_size=”initial”][et_pb_column type=”3_4″][et_pb_text background_position=”top_left” background_repeat=”repeat” background_size=”initial” _builder_version=”3.0.83″]

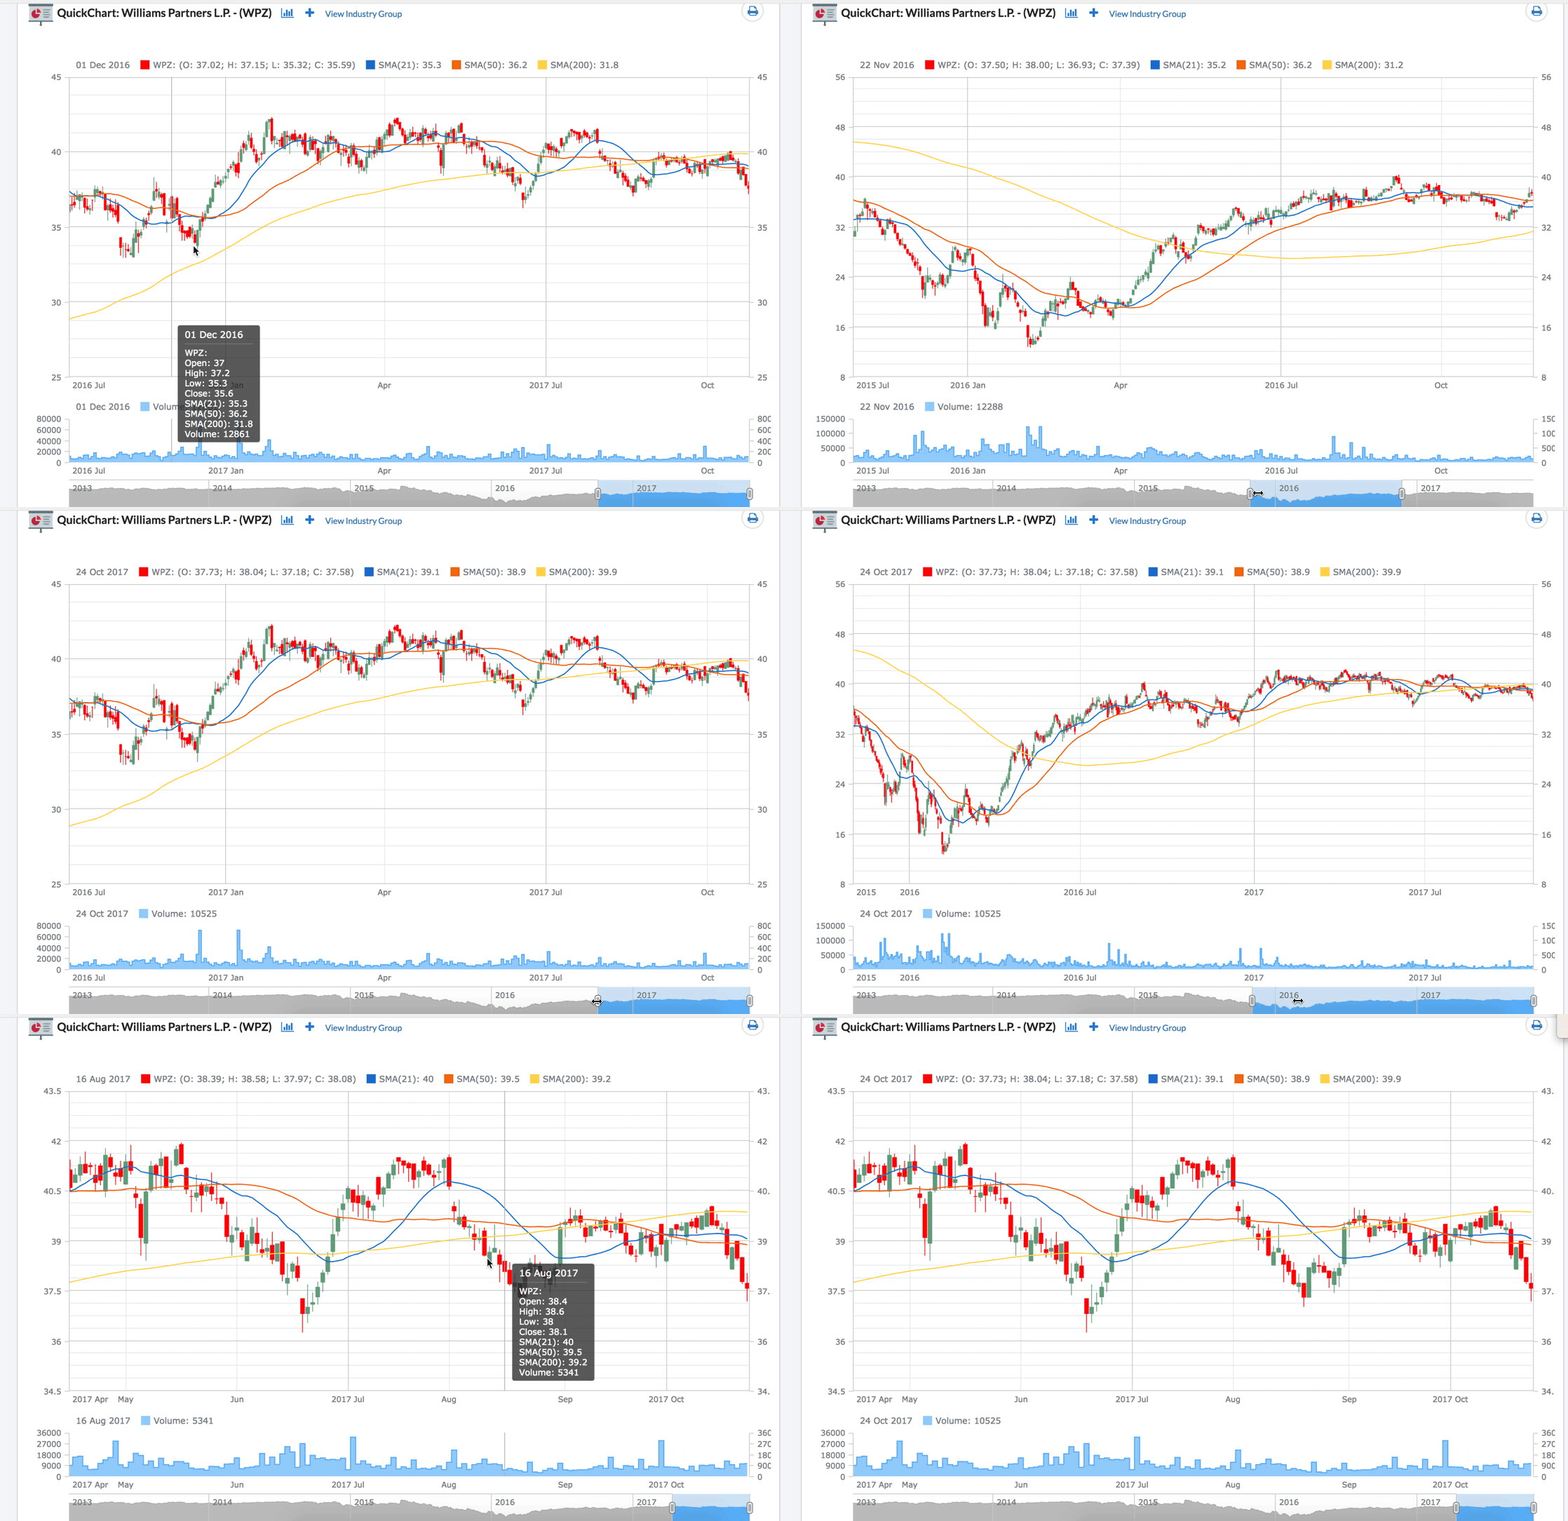
QuickCharts are all new and provide a subset of the features available in SmartCharts.
What is New?
- 3 Simple Moving Averages
- 21 day, 50 day and 200 day moving averages you can toggle on and off.
- Color Coded Daily Candlestick Price Chart
- Candlestick charts are similar to the OHLC charts as they indicate the Open, High, Low and Closing prices for the dat. The BODY of the candle (the thick part) is between the day’s Open and Close. Red indicates the Close was lower than the Open, Green indicates the close was HIGHER than the open. The thin lines are called the WICKS and represent the trading High and Low for each day.
- Daily Trading Volume
- Bar chart of daily trading volume below Price Chart
- Customize Chart Timeframe
- Zoom and pan to get a closer look at price movement. Either use the slider bar below the Volume to shorten or lengthen the timeframe (zoom) or slide the blue portion of the bar back and forth to look back in history using the same timeframe (Pan). You can also use your mouse to pan the chart, just remember to look at the dates after you have played with the chart to make sure you are not making current investment decisions based on a chart you panned back in time!
One Click Add To Watchlist
- Click the + at the top of the chart, select a Stockwatch list and the stock is added right way!
- Jump to SmartChart
- If you are a Platinum subscriber (or above) you can jump directly to SmartChart to do more in depth chart analysis
- Second Opinion beneath the chart
- Get the current Second Opinion as well as Second Opinion Date and Price Opinion Formed.
- Print Chart
- Once you have what you want, click the Printer Icon on the top of the page to print your chart.
[/et_pb_text][/et_pb_column][et_pb_column type=”1_4″][et_pb_blog admin_label=”What’s New” _builder_version=”3.0.83″ include_categories=”4″ show_content=”off” show_thumbnail=”on” show_more=”on” show_author=”off” show_date=”on” show_categories=”off” show_comments=”off” show_pagination=”off” fullwidth=”on” use_dropshadow=”off” use_overlay=”off” background_layout=”light” pagination_font_size_tablet=”51″ pagination_line_height_tablet=”2″ /][/et_pb_column][/et_pb_row][/et_pb_section][et_pb_section bb_built=”1″][et_pb_row][/et_pb_row][/et_pb_section]


